Synergist's reporting function gives you complete visibility on what’s happened, what’s happening and what’s going to happen across your agency. Instead of spending endless hours compiling data, you'll have all the information you need at your fingertips.
Synergist dashboards bring all your data together into a single source of truth. See all the key metrics you need, at the click of a button.
Is your reporting moving you forward… or just looking backwards? See the key metrics that will help you improve performance
Knowing what's on track or, more importantly, what's not on track, can help to drive a successful project.
See more on agency project tracking
See why thousands of design, digital, marketing and PR agencies - from 10 to 500 people - choose Synergist to manage their projects more intelligently and profitably.
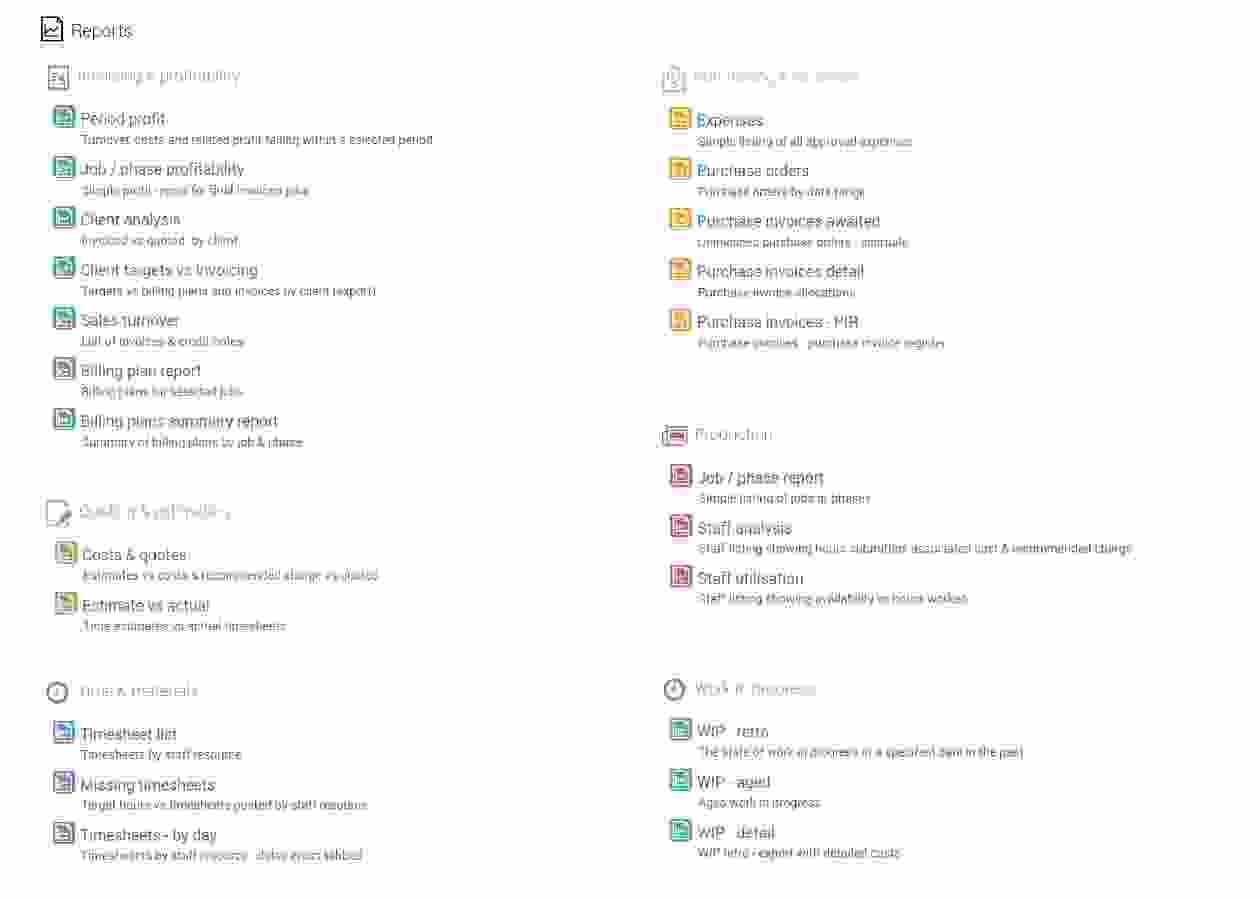
Synergist delivers a suite of detailed reports to help you make intelligent business decisions and improve your agency’s performance and profitability.
See more agency management features
 "We now get reporting on Quotes versus Estimates versus Actuals. This means that we can look at what’s charged vs what it should cost vs what it actually cost.”
Andrea Allen, Operations Director, Rooster Punk
 "The main thing is we can report on over-servicing so we can take action. There's absolutely no doubt that bringing in Synergist has really helped us ensure we've got the right financial controls in place."
Peter McQueen, Finance Director, Mediablaze
From top-level insights to highly detailed data, Synergist makes it easy to build your own reports, using the Data viewer reporting tool.
Learn more about the advanced analytics features
Whatever your agency looks like – 10 to 500 people, design to digital – Synergist can be shaped to the way you work.
Synergist consultants, Agency Works, will be in touch to arrange your bespoke demo. Their experience working with hundreds of agencies means they can help you work out if Synergist is right for you.
From new business, costing, project and resource management, through to billing and reporting, Synergist brings together everything you need to manage your agency's projects, people, clients and financials.