The detail of the data that’s available and the fact it’s live data is brilliant. This data will help to guide our future strategy of where to focus.
Synergist's analytics tool works like an integrated pivot table for your agency data. Choose your data fields, add filters and date ranges, cross-tab variables, and see the results as tables or interactive charts. Build a report for a specific meeting, a deep dive, or save it for ongoing use.
Combine multiple reports and charts into custom agency dashboards using drag and drop. Set up different views by role so agency leadership sees the high-level picture while project managers and finance see the detail they need. Reporting permissions keep sensitive data secure.
CWA, a marketing agency, uses Synergist's advanced analytics to access real-time data and inform its business strategy.
The detail of the data that’s available and the fact it’s live data is brilliant. This data will help to guide our future strategy of where to focus.
Excel can do almost anything with data, given enough time. The problem is getting the data into it. You end up exporting from multiple systems, cleaning it, and building the same report every month. By the time it's done, the numbers are already old.
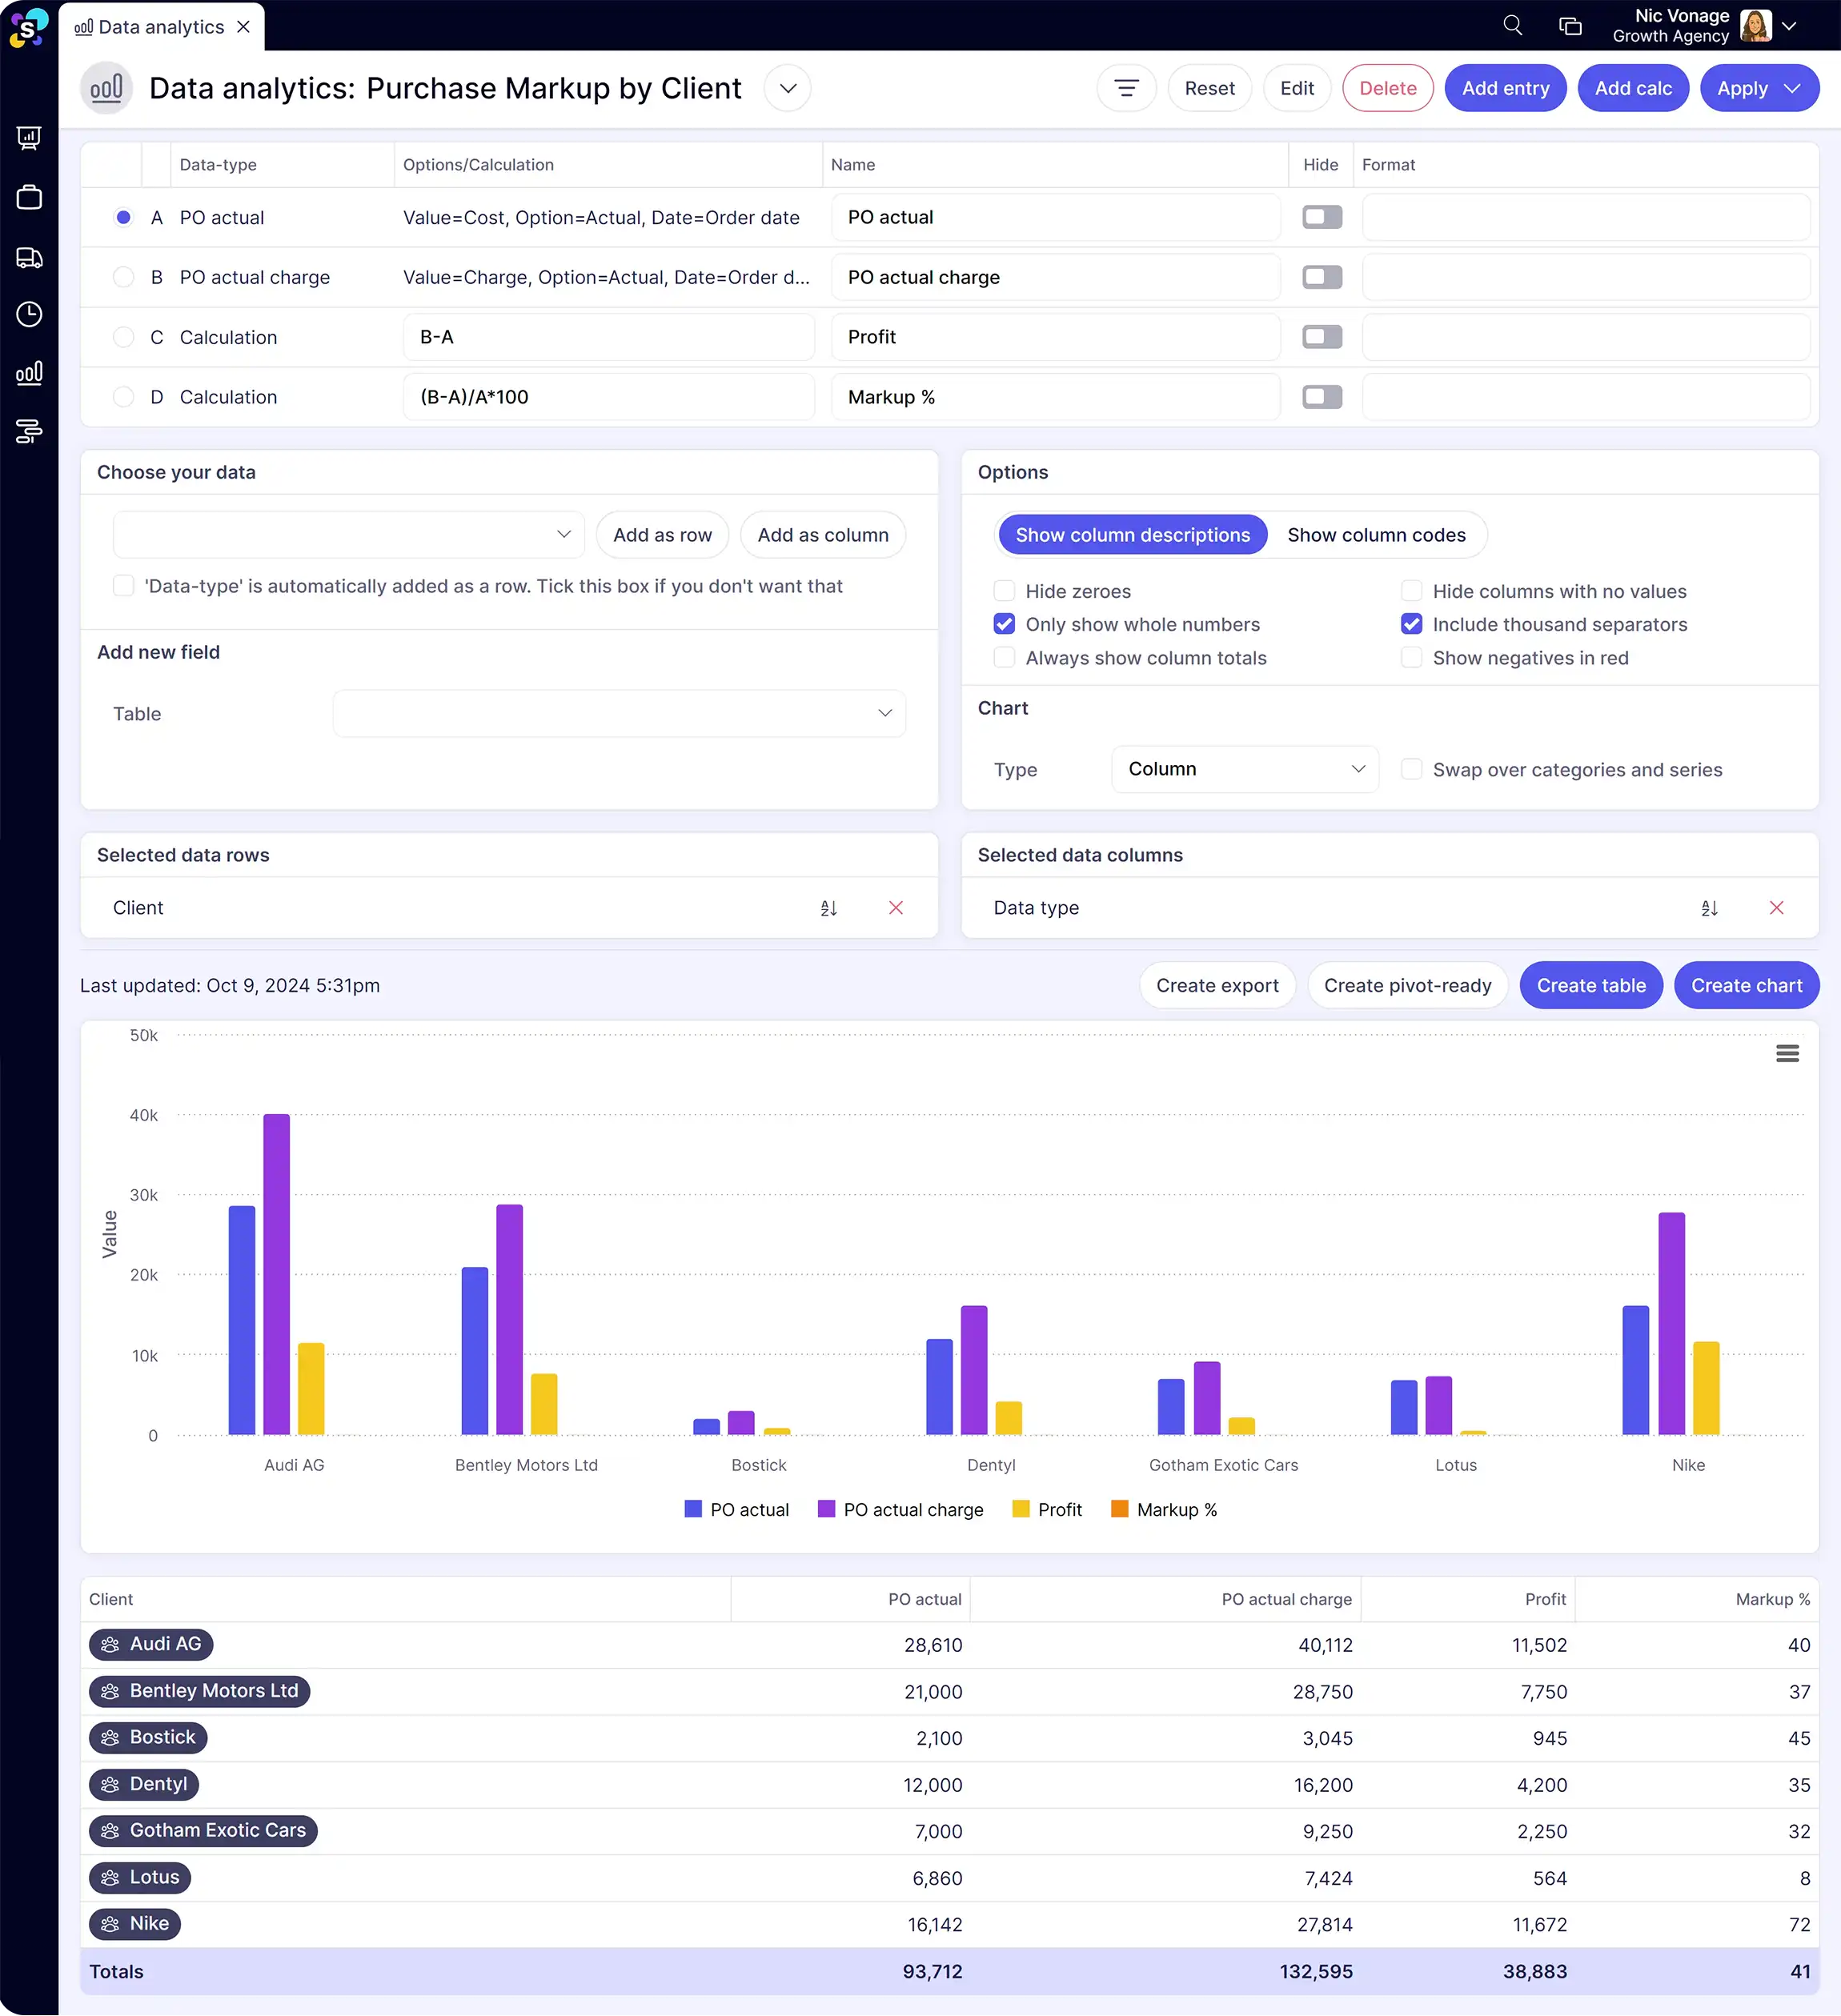
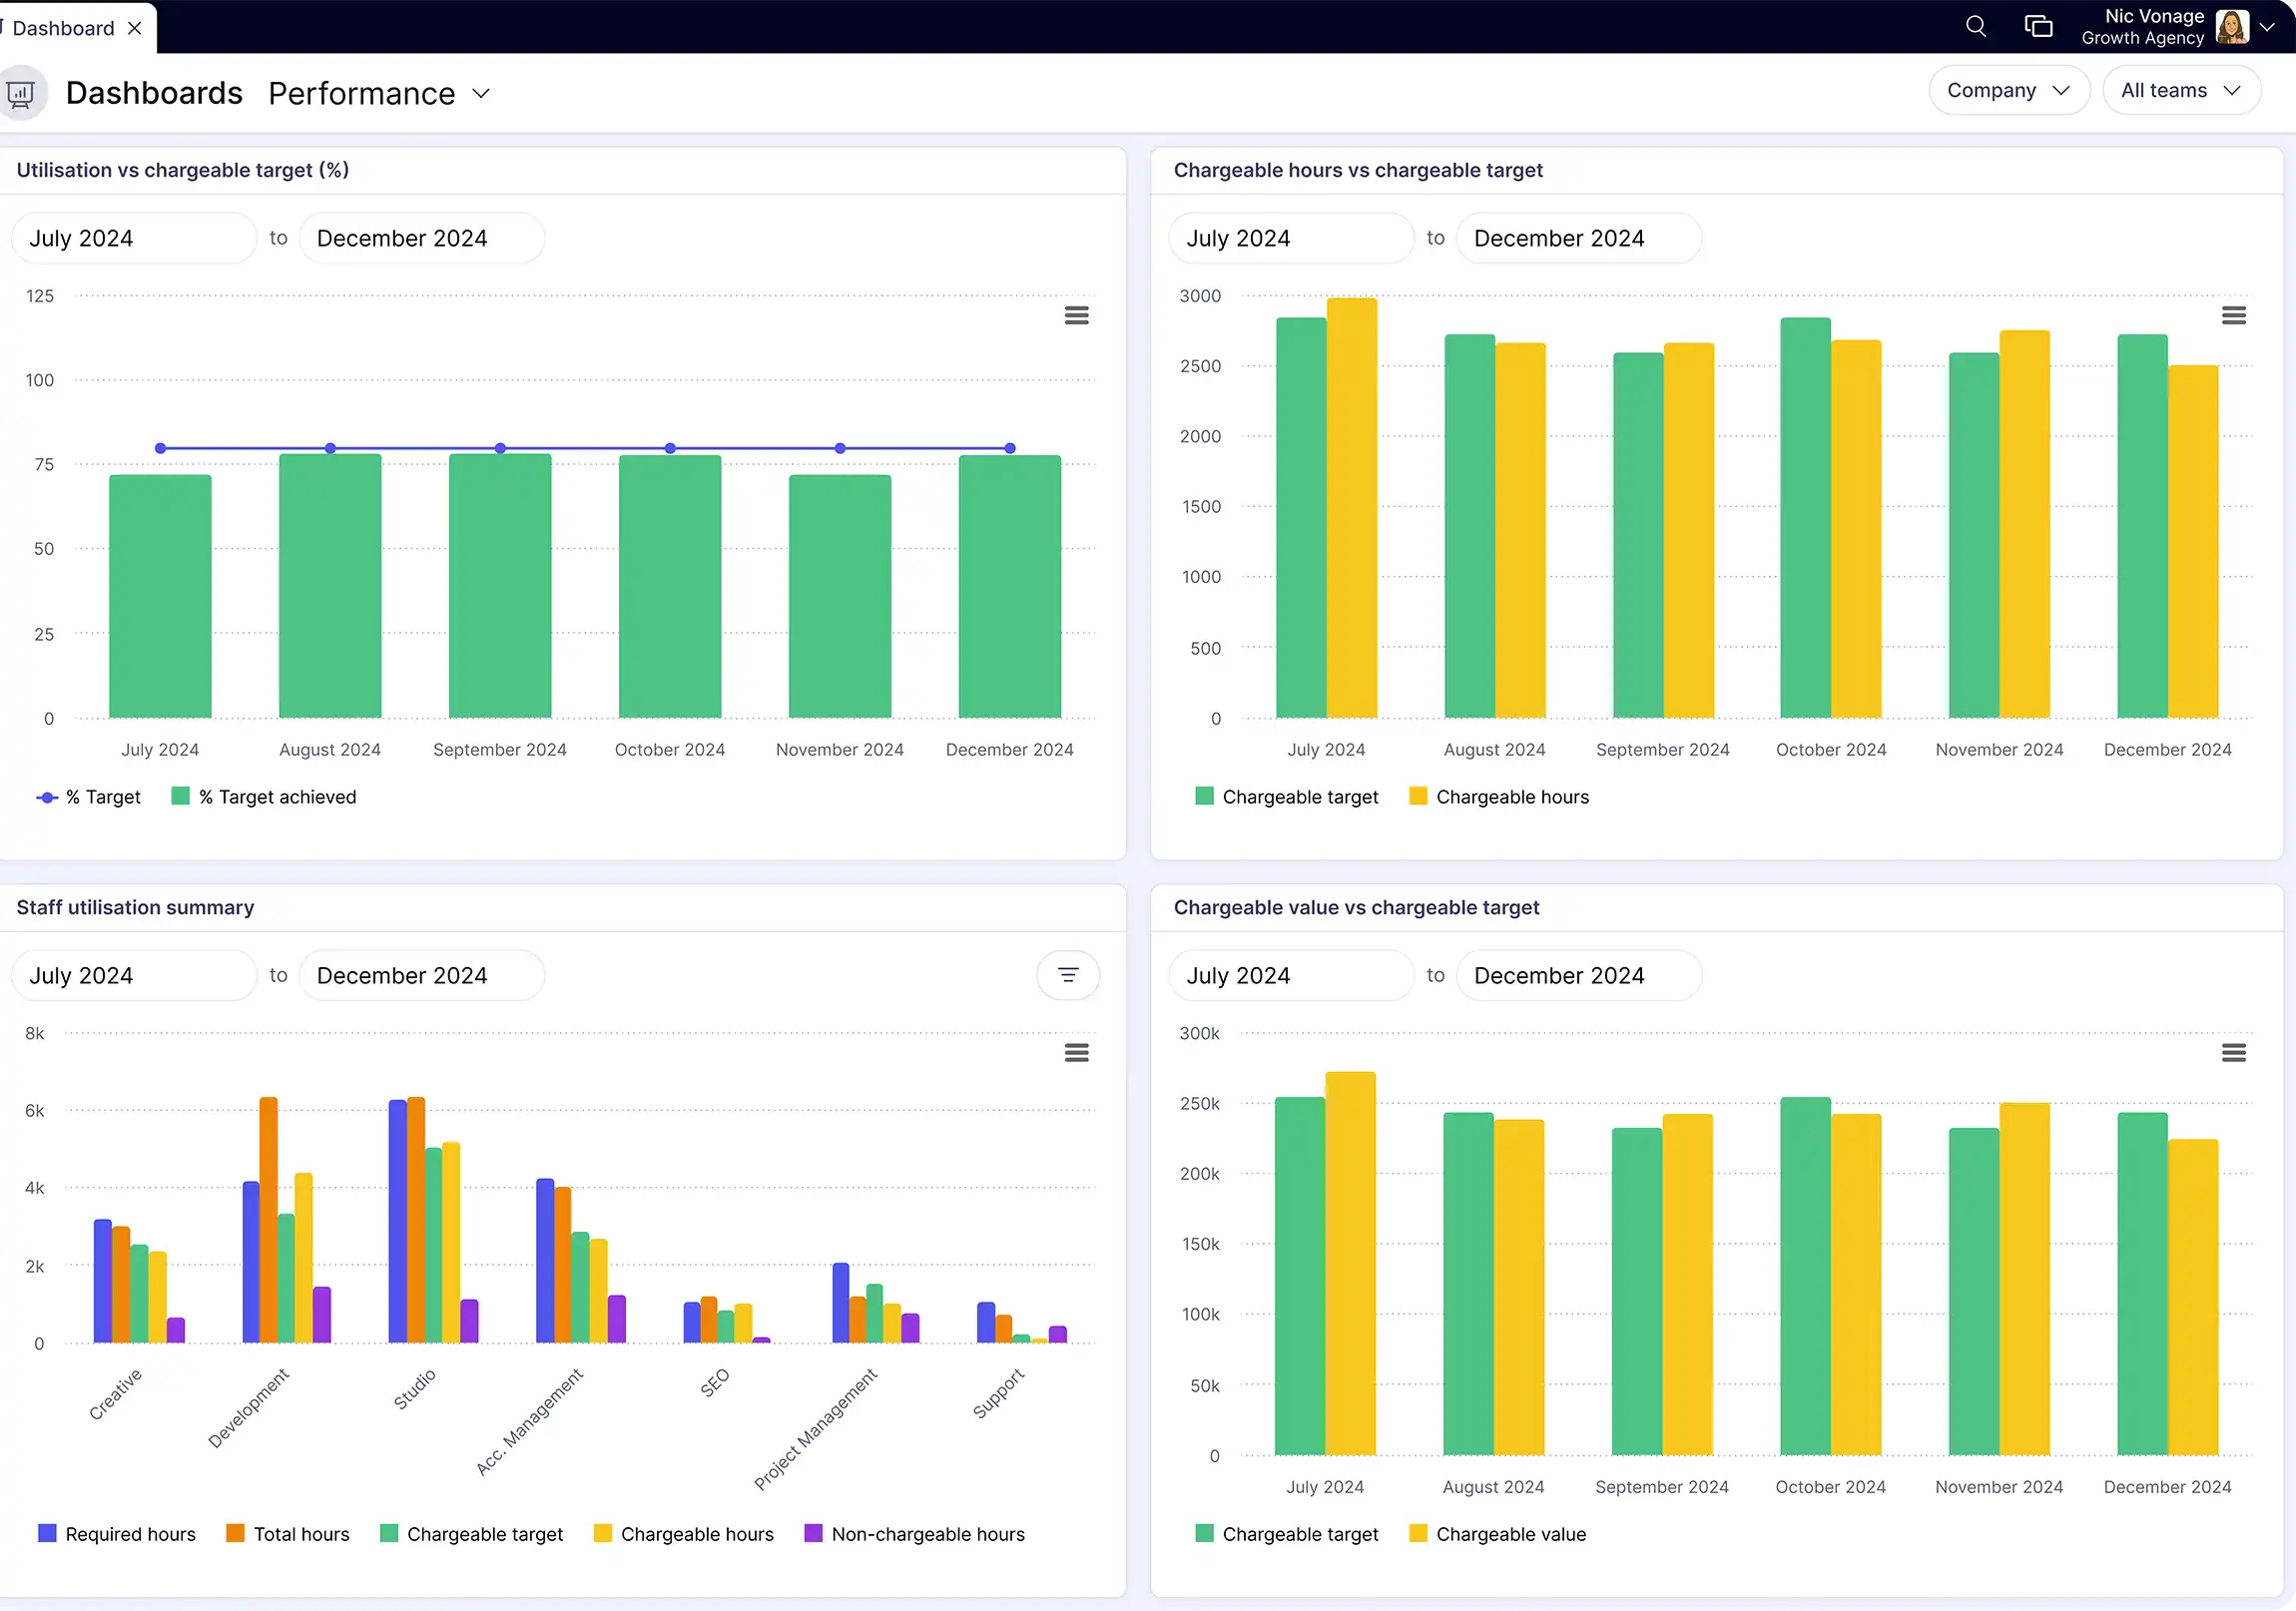
Synergist's analytics tool reports directly from live project data. There's no export, no cleanup, no manual reconciliation. When time is logged or a cost comes in, the report updates. And because it's built into your agency management system, you can cross-tab project data, financial data, and resource data in a single report, which no standalone BI tool can do without integration work.
Want a deeper look? Watch our product tour to see how agencies manage reporting and analytics with Synergist
Once you've built a report, Synergist makes it easy to share across your agency. Email reports directly, export to CSV or Excel, download charts as images or PDFs, or schedule regular delivery to individuals or distribution groups. You can also feed report data into other systems via the API.
Synergist lets you report on any combination of revenue, costs, profit, utilisation, capacity, opportunities, and activities. You can cross-tab fields, add custom calculations, and filter by client, team, job type, date range, or custom fields.
Yes. Synergist lets you combine multiple reports and charts into custom dashboards using drag and drop. You can create different dashboard views for different roles, so leadership, finance, and project managers each see the data most relevant to them.
Yes. Synergist lets you schedule reports to be emailed to individuals or distribution groups at set frequencies, days, times, and formats. You can also export data to CSV or Excel and download charts as images or PDFs.
Synergist includes built-in dashboards for management, sales, performance, and capacity that show key metrics at a glance. The advanced analytics tool goes deeper, letting you build bespoke reports with custom filters, cross-tabs, calculations, and visualisations. Both pull from the same live data.
Have more questions? Drop us an email enquires@synergist.co.uk
Business analysis often skips the to-do list, especially when you're too busy working in your business (the fun stuff). But you could be missing out on a game-changer.